WASSCE Physics · Practical Physics Skills
Practical skills: tables, graphs, gradients and precautions
By the WASSCE Tutor team
Updated 10 November 2026 · 7 min read · Prepared against the WASSCE syllabus.
The WASSCE Physics practical paper is worth a large share of your mark, and it rewards habits more than brilliance: careful readings, a neat table, a well-drawn graph and precise precautions. This lesson covers the habits that earn those marks.
Learning objectives
By the end of this lesson you should be able to:
- record readings correctly in a table with units and sensible precision
- choose scales and plot graphs accurately
- draw a line of best fit and find its gradient and intercept
- state specific precautions and sources of error
Before you start
- Read the whole question first: note what to measure, how many readings, and what graph to plot.
- Check the apparatus: the zero of meters and scales, that the metre rule is not worn at the end, that connections are tight.
- Plan your readings: spread them evenly over the full range (for example, five or six values of length from 20 cm to 90 cm).
Recording readings
| Rule | Example |
|---|---|
| Put quantity and unit in each column heading, separated by a slash | / cm, / s, / s² |
| Record readings to the precision of the instrument | metre rule: 45.0 cm (to 0.1 cm); stopwatch: 18.4 s |
| Keep the same number of decimal places in a column | 20.0, 30.0, 40.0 — not 20, 30.5, 40 |
| Record raw readings before calculated values | for 20 oscillations, then , then |
| Give calculated values to 3 significant figures (usually) | s² |
| Repeat readings and record the average | , , mean |
A well-recorded pendulum table:
| / cm | / s (20 osc.) | / s | mean / s | / s | / s² |
|---|---|---|---|---|---|
| 30.0 | 22.0 | 22.2 | 22.1 | 1.11 | 1.22 |
| 50.0 | 28.4 | 28.2 | 28.3 | 1.42 | 2.00 |
| 70.0 | 33.6 | 33.4 | 33.5 | 1.68 | 2.81 |
Plotting graphs
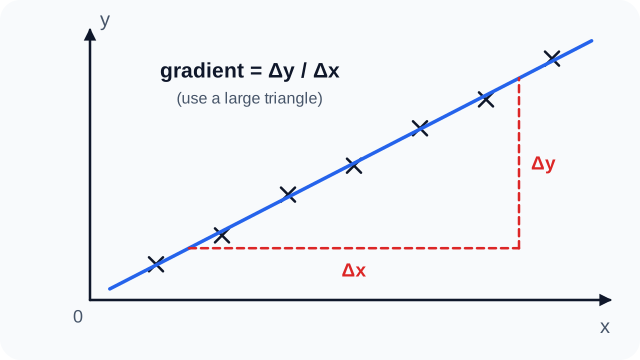
Figure 1. A line of best fit and a large gradient triangle. WASSCE Tutor diagram.
- Plot the quantity asked for on each axis: "plot against " means on the vertical (y) axis, on the horizontal (x) axis.
- Label both axes with quantity and unit.
- Choose sensible scales (1, 2 or 5 units per large square — never 3 or 7) so the points fill at least half of the graph paper in each direction.
- Start from the origin if you need the intercept; otherwise a "false origin" is allowed.
- Plot points precisely with small, neat crosses or dots in circles.
- Draw one thin, straight line of best fit with roughly equal numbers of points on each side. Do not join the dots, and do not force the line through the origin unless the theory says it must pass through it.
Finding the gradient
- Draw a large right-angled triangle on the line — at least half the length of the line.
- Read off and from the triangle's sides, with units.
- Gradient , given with its unit.
Use points on the line, not data points from the table (unless they lie exactly on it).
A graph of (s²) against (m) is a straight line through the origin. A triangle drawn on it has Δ(T²) = 3.20 s² and Δl = 0.80 m. Find g.
Gradient s² m⁻¹. Since , gradient :
Precautions and sources of error
Precautions must be specific to the experiment. Avoid vague statements such as "I was careful".
| Weak (no mark) | Strong (earns the mark) |
|---|---|
| "I took the readings carefully" | "I read the metre rule with my eye directly above the mark to avoid parallax" |
| "I avoided errors" | "I timed 20 oscillations instead of one to reduce the effect of reaction time" |
| "I checked the meters" | "I checked and corrected the zero error of the ammeter before starting" |
| "The connections were good" | "I switched off between readings to prevent the wire from heating up" |
Common sources of error: parallax, zero error, reaction time in timing, heat losses (in heat experiments), friction (in pulleys), heating of resistance wires, draughts (pendulums), and non-uniform apparatus.
Key points
- Column headings: quantity / unit; consistent decimal places; repeat and average.
- y-axis is the first quantity named ("plot y against x"); sensible scales filling the paper.
- One thin line of best fit; large gradient triangle; gradient with units.
- Precautions must name the specific action and the error it prevents.
WASSCE examination focus
In the practical paper, marks are given for tabulation (headings and units, precision), the graph (axes labelled, suitable scale, points correctly plotted, good line), the gradient (large triangle, correct reading), the deduction (using the gradient to find the quantity asked) and two precautions. Lose none of these routine marks.
Quick check
- In "plot against ", which quantity goes on the vertical axis?
- Why should the gradient triangle be large?
- Give a precaution when timing a pendulum.
Answers: 1. . 2. To reduce the percentage error in reading Δy and Δx. 3. For example: time 20 oscillations and find the average period, or start timing as the bob passes the lowest point.
Keep going with practical physics skills
This is one of 2 lessons in Practical Physics Skills. Start free with the first lesson of every topic, then unlock them all, plus exam-style practice marked instantly and guided learning tools, from 25 NLe.
- Free account, no card needed
- Everything from 25 NLe
- No automatic renewal
More lessons in Practical Physics Skills
- The standard WASSCE experiments and handling errors🔒