WASSCE Economics · Tools of Economic Analysis
Tables, charts and graphs in economics
By the WASSCE Tutor team
Updated 12 November 2026 · 8 min read · Prepared against the WASSCE syllabus.
"Rice prices are going up" is an opinion until someone shows the figures. Economists turn numbers into tables, charts and graphs so that patterns can be seen at a glance. WASSCE asks you to draw and read every one of them.
Learning objectives
By the end of this lesson you should be able to:
- present economic data in tables
- draw and read bar charts, pie charts, line graphs and histograms
- choose the right kind of chart for a set of data
Why economists use tools
Economists work with large amounts of information: prices, output, incomes, population. Tables, charts and graphs make this information easier to read, compare and explain. WAEC expects you to construct these and to interpret them.
Tables
A table arranges data in rows and columns. A good table has:
- a clear title
- headings for every column, with units (bags, NLe, %)
- the source of the data where it is known
Rice sold by a shop in one week
| Day | Bags sold |
|---|---|
| Monday | 12 |
| Tuesday | 8 |
| Wednesday | 10 |
| Thursday | 6 |
| Friday | 14 |
| Total | 50 |
From the table we can see at a glance that Friday was the busiest day and Thursday the quietest.
Bar charts
A bar chart shows quantities as bars of equal width; the height (or length) of each bar shows the value.
- Use it to compare separate items or periods, such as sales on different days.
- Leave equal gaps between the bars.
- Label both axes and start the value axis at zero.
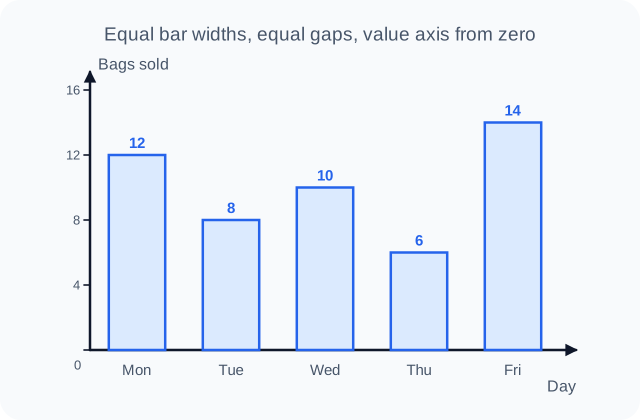
Figure 1. Bar chart of the rice sales in the table above. WASSCE Tutor diagram.
A component (subdivided) bar chart splits each bar into parts, for example a family's spending each year divided into food, rent and transport.
Pie charts
A pie chart is a circle divided into sectors. Each sector shows a share of the whole.
Because a full circle is 360°, each item's angle is:
A household spends NLe 600 a month:
| Item | Spending (NLe) | Angle |
|---|---|---|
| Food | 300 | |
| Rent | 150 | |
| Transport | 90 | |
| School fees | 60 | |
| Total | 600 | 360° |
Always check that your angles add up to 360°.
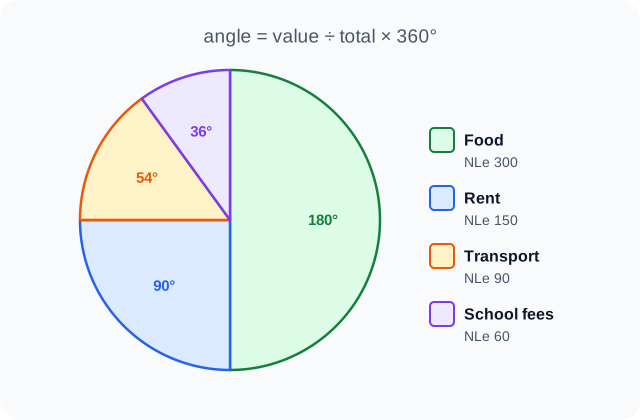
Figure 2. Pie chart of the household spending in the table. WASSCE Tutor diagram.
Students often draw a pie chart without first working out the angles, or forget to check the total. Show your working in a table like the one above: examiners award marks for the calculation as well as the drawing.
Line graphs
A line graph joins plotted points with a line. It is best for showing how something changes over time, such as the price of rice month by month.
- Time goes on the horizontal (x) axis.
- The variable being measured goes on the vertical (y) axis.
- A rising line shows an increase; a falling line shows a decrease; a steep line shows fast change.
Price of a 50 kg bag of rice (illustrative figures, NLe)
| Month | Price (NLe) |
|---|---|
| January | 650 |
| February | 660 |
| March | 700 |
| April | 720 |
| May | 760 |
| June | 750 |
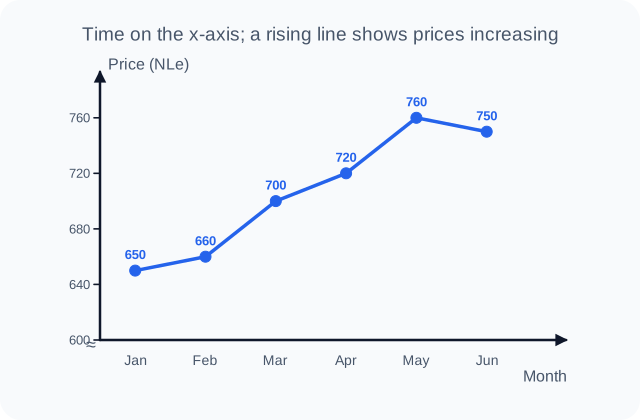
Figure 3. Line graph of the rice prices in the table. WASSCE Tutor diagram.
The line rises steeply from February to March (+40) and from April to May (+40), and falls slightly in June. The vertical axis starts at NLe 600, shown by the break mark (≈) near the origin, so that the changes are easy to see.
Graphs of relationships
Economists also use graphs to show how two variables are related. A demand curve, for example, plots price against quantity demanded. When one variable rises as the other falls, the line slopes downwards (a negative or inverse relationship). When both rise together, it slopes upwards (a positive or direct relationship).
Histograms
A histogram shows a frequency distribution of grouped, continuous data, such as incomes or ages in classes. It looks like a bar chart, but:
- the bars touch, because one class runs straight into the next
- the area of each bar represents the frequency (with equal class widths, the height does too)
Daily earnings of 40 market traders
| Earnings (NLe) | 0–49 | 50–99 | 100–149 | 150–199 | 200–249 |
|---|---|---|---|---|---|
| Number of traders | 4 | 9 | 14 | 8 | 5 |
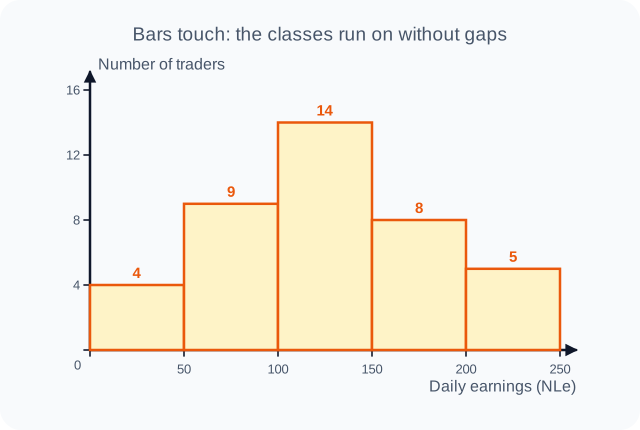
Figure 4. Histogram of the traders' earnings. WASSCE Tutor diagram.
The tallest bar shows the modal class: NLe 100–149, earned by 14 traders.
Choosing the right tool
| You want to show… | Use |
|---|---|
| Exact figures for reference | A table |
| A comparison between separate items | A bar chart |
| Shares of a total | A pie chart (or a component bar chart) |
| A change over time | A line graph |
| How grouped, continuous data is spread | A histogram |
| The relationship between two variables | A graph with both variables on the axes |
Key points
- Every table, chart and graph needs a title, labelled axes or headings and units.
- Pie chart angle = value ÷ total × 360°.
- Use bar charts to compare, pie charts for shares, line graphs for trends and histograms (touching bars) for grouped frequency data.
WASSCE examination focus
Data questions are common. You may be asked to construct a pie chart or bar chart from a table, or to read a graph and explain a trend. Use a ruler and protractor, label everything, give a title and show calculations. When interpreting, quote figures from the data ("sales rose from 6 bags on Thursday to 14 on Friday") rather than describing in general terms.
Quick check
- A firm's total costs are NLe 2,000, of which wages are NLe 500. What angle would wages take in a pie chart?
- Which chart is best for showing how the price of fuel changed over twelve months?
- What does a downward-sloping line on a graph tell you about two variables?
Answers: 1. . 2. A line graph. 3. They have an inverse relationship: as one rises, the other falls.
Keep going with tools of economic analysis
This is one of 2 lessons in Tools of Economic Analysis. Start free with the first lesson of every topic, then unlock them all, plus exam-style practice marked instantly and guided learning tools, from 25 NLe.
- Free account, no card needed
- Everything from 25 NLe
- No automatic renewal
More lessons in Tools of Economic Analysis
- Mean, median, mode and standard deviation🔒