WASSCE Economics · Demand
What demand is and the law of demand
By the WASSCE Tutor team
Updated 12 November 2026 · 7 min read · Prepared against the WASSCE syllabus.
Watch a plantain seller at Dove Cut market cut her price late in the afternoon, and the crowd at her stall grows. That pattern, more bought at a lower price, is the law of demand, and its graph is the most drawn diagram in WASSCE Economics.
Learning objectives
By the end of this lesson you should be able to:
- define demand and effective demand
- draw a demand schedule and a demand curve
- build a market demand schedule from individual schedules
- state the law of demand and explain why the demand curve slopes downwards
What is demand?
Demand is the quantity of a good or service that consumers are willing and able to buy at a given price, over a given period of time.
Three ideas are packed into this definition:
- Willing and able: wanting something is not enough. A pupil who would love a laptop but has no money for it does not demand it in the economic sense.
- At a given price: demand is always linked to a price.
- Over a period of time: per day, per week or per month.
Effective demand is the desire for a good backed by the ability to pay for it. In economics, "demand" always means effective demand.
The demand schedule
A demand schedule is a table showing the quantities of a good demanded at different prices.
Weekly demand for bunches of plantain at a market in Kenema
| Price per bunch (NLe) | Quantity demanded (bunches) |
|---|---|
| 30 | 0 |
| 25 | 20 |
| 20 | 40 |
| 15 | 60 |
| 10 | 80 |
| 5 | 100 |
As the price falls, more bunches are demanded.
An individual demand schedule shows one buyer's demand. The market demand schedule adds up the quantities demanded by all buyers at each price.
From individual to market demand. Three households, A, B and C, buy plantain each week:
| Price (NLe) | A | B | C | Market demand |
|---|---|---|---|---|
| 20 | 2 | 1 | 0 | 3 |
| 15 | 3 | 2 | 1 | 6 |
| 10 | 5 | 3 | 2 | 10 |
At each price, add across the row: at NLe 15 the market demand is bunches. The market demand curve is the horizontal sum of the individual demand curves.
The demand curve
Plot the schedule on a graph with price on the vertical axis and quantity demanded on the horizontal axis, then join the points. The result is the demand curve, labelled D. It slopes downwards from left to right.
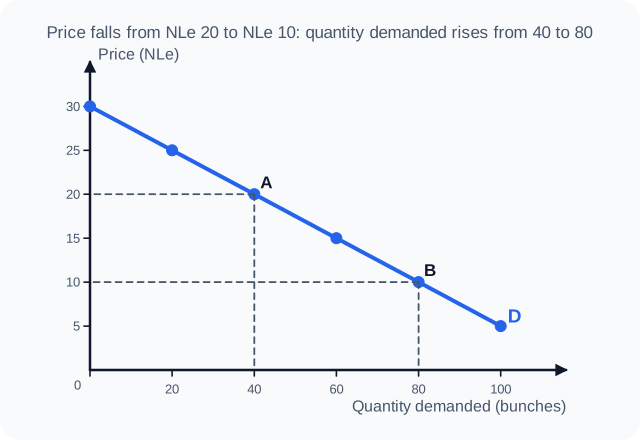
Figure 1. The demand curve for plantain, drawn from the schedule. WASSCE Tutor diagram.
Moving from A to B, the price falls and the quantity demanded rises: an extension of demand. Moving from B to A is a contraction of demand.
In economics, price always goes on the vertical (y) axis and quantity on the horizontal (x) axis, even though price is the cause. Swapping the axes is a common way to lose marks.
The law of demand
The law of demand states that, other things being equal, the higher the price of a good, the lower the quantity demanded; and the lower the price, the higher the quantity demanded.
Price and quantity demanded move in opposite directions: an inverse relationship.
Why the demand curve slopes downwards
- The income effect. When the price of a good falls, the buyer's money goes further: their real income rises, so they can buy more.
- The substitution effect. When the price of a good falls, it becomes cheaper compared with its substitutes, so buyers switch to it. If plantain becomes cheaper, some families buy plantain instead of yam.
- Diminishing marginal utility. Each extra unit of a good gives less satisfaction than the one before, so consumers will buy more only at a lower price.
- New buyers. A lower price brings in people who could not afford the good before.
- Different uses. At a lower price a good may be used for more purposes; cheap palm oil may be used for soap-making as well as cooking.
When mangoes are in season and the price falls, families buy more of them, children eat them as snacks, and some traders buy them to make juice. When the season ends and prices rise, people buy far fewer.
Key points
- Demand = the quantity consumers are willing and able to buy at a given price, over a period.
- A demand schedule is a table; a demand curve is its graph, sloping downwards.
- The law of demand: price up, quantity demanded down (other things being equal).
- The curve slopes down because of the income effect, the substitution effect and diminishing marginal utility.
WASSCE examination focus
You may be asked to define demand, state the law of demand, draw a demand curve from a schedule and explain why it slopes downwards. Label the axes (Price (NLe), Quantity demanded), plot accurately, label the curve D, and always include other things being equal when you state the law.
Quick check
- Why does a pupil who wants a car but has no money not "demand" one?
- Using the schedule above, how many bunches are demanded at NLe 15?
- State the law of demand.
Answers: 1. Because demand must be backed by the ability to pay (effective demand). 2. 60 bunches. 3. Other things being equal, the higher the price, the lower the quantity demanded, and the lower the price, the higher the quantity demanded.
Keep going with demand
This is one of 2 lessons in Demand. Start free with the first lesson of every topic, then unlock them all, plus exam-style practice marked instantly and guided learning tools, from 25 NLe.
- Free account, no card needed
- Everything from 25 NLe
- No automatic renewal
More lessons in Demand
- Determinants of demand, shifts and types of demand🔒